The world of digital acquisition has never been so dynamic.
With the rise of generative AI and the constant evolution of algorithms (in particular the strengthening of the E-E-A-T criteria, Experience, Expertise, Authoritativeness, Trustworthiness), SEO faces unprecedented challenges.
In 2025, SEO is no longer a simple technical optimisation. It is the main acquisition lever for working towards sustainable growth and reducing dependence on costly advertising platforms.
Navigating this complex ecosystem without reliable data, however, is like flying blind.
Knowing the key figures lets you secure your ROI and prioritise the actions that will have a real impact on your performance.
This article gives you the 20 most crucial SEO statistics for 2025. These figures will let you arbitrate your budgets, refine your content strategy and make genuinely data-driven decisions.
Category 1: search and user behaviour statistics (the “wide angle”)
Understanding user behaviour is the foundation of any SEO strategy. In 2025, the user journey is less and less linear, largely because of the growing integration of AI answers directly into results pages.
Statistic 1: average click-through rate (CTR) for position 1 on desktop
Around 18%. The first organic result on desktop still captures the largest share of traffic. However, this figure is in slight but steady decline, as rich results (images, videos) and instant answers (statistics 4-6) eat into some of the clicks historically reserved for that position.
Statistic 2: average click-through rate (CTR) for position 1 on mobile
Around 12%. The dominance of the first result is weaker on mobile. As the screen is smaller, it is more easily swamped by SERP features (ads, maps, carousels, AI answers), which pushes the first organic link further down, reducing its CTR.
Statistic 3: CTR gap between position 1 and position 2
The CTR of position no. 2 is, on average, twice as low as that of position no. 1. That gap underlines the importance of investing to reach the top. The difference in traffic between the first and the second page is often the deciding factor in a positive ROI.
Statistic 4: the growing share of “Zero-Click Search”
More than 60% of searches (across all engines) may end with no click at all.
Search engines provide direct answers, through featured snippets or AI-generated summaries (SGE). If you are not in that quick answer, you risk not being seen at all. The goal is no longer only to be number 1, but to be the “Zero Answer”.
Statistic 5: impact of AI answers (SGE) on organic links
In SGE testing, AI-generated summaries hold the user’s attention for the first 10 to 15 seconds, the crucial moment of the decision to click.
The organic links listed under the AI summary are exposed later. Companies need to optimise their content to be quoted or referenced by the AI itself in order to gain authority (E-E-A-T).
Statistic 6: the rate of long-tail queries
Long-tail queries (four words or more) account for around 70% of total SEO traffic.
Despite the upheaval brought by AI, most traffic is still generated by precise, less competitive questions. Optimising for the long-tail is the most reliable route towards qualified traffic and a better conversion rate.
➡️ Recommendation: your strategy should aim for Featured Snippets (position zero) and optimisation for SGE (Search Generative Experience) so you appear directly in the answer.
Statistic 7: share of voice searches
Although less dominant than expected, voice search continues to represent a significant share of local and informational traffic. It is estimated that 25 to 30% of all searches involve a voice component (via assistants, phones, etc.).
➡️ Recommendation: optimise your content for long questions and natural language.
💡READ: How search is changing in 2026: from ranking to decision
 Digital marketing funnel: the conversion process.
Category 2: content and E-E-A-T statistics (authority)
With AI able to produce content quickly, Google places even more importance on quality, depth and, above all, the credibility (E-E-A-T) of content.
Statistic 8: correlation between content length and ranking
Pages ranking in the Top 10 for competitive and informational keywords contain on average 2,000 words or more. Length is not an end in itself, but it is an indicator of exhaustive coverage of the subject.
Statistic 9: average time on page (Dwell Time)
A high Dwell Time (time spent by the user on the page) is a strong quality signal. Well-ranked pages often keep users for 3 to 5 minutes, showing that the content answers the search intent.
Statistic 10: the importance of images and video
Search results including a visual element (video or optimised image) show a click-through rate 15 to 25% higher than purely textual results. Rich content is essential.
Statistic 11: structure and H2/H3 headings
Nearly 95% of pages ranked in the Top 10 use H2 and H3 tags to structure their content. These tags help not only the user, but also AI and crawlers, to understand the hierarchy and completeness of the topic.
Statistic 12: growth in comparison intent
Queries of the “VS” (versus) type or “Best [Product] 2025” are growing by more than 35% a year.
➡️ Recommendation: comparison content is critical for capturing users at the decision stage.
💡READ: The best SEO tools
Category 3: technical and off-page statistics (foundations and link building)
Content is king, but speed (technical) and authority (reputation) are the two pillars that make sure Google finds your content and trusts it. These factors are essential to the scalability of your SEO strategy.
Statistic 13: correlation between loading speed (Core Web Vitals) and conversion rate
An improvement of 0.1 seconds in loading speed can bring an increase in the conversion rate of up to 8% (according to Web Vitals studies). Technical performance is a ranking factor and a revenue factor.
Statistic 14: HTTPS adoption rate
Nearly 99% of sites ranked in the Top 10 use the secure HTTPS protocol. Security is no longer a competitive advantage, it is a non-negotiable prerequisite.
Statistic 15: average number of backlinks
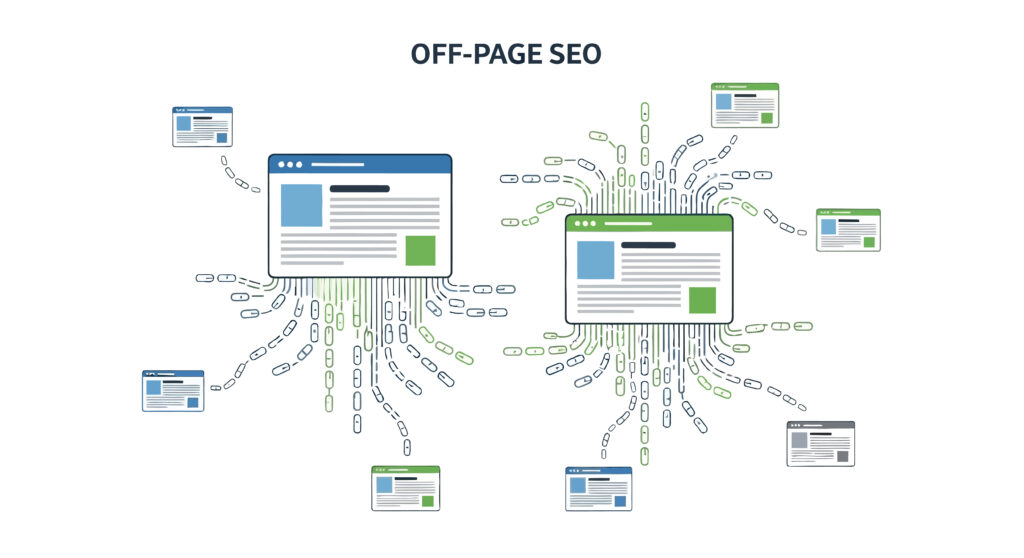
Pages ranking number 1 on highly competitive keywords often need 3 to 5 times more backlinks than those ranking in position 10. External authority remains crucial for high-value queries.
Statistic 16: the influence of internal links
Internal links can account for 10 to 20% of your pages' performance, particularly for “deep” content. A solid, relevant internal linking structure is the most underestimated lever for distributing “link juice” (link equity) across your site.
Statistic 17: link survival rate (Link Rot)
It is estimated that between 5% and 10% of the backlinks earned become inactive or point to an error (404) each year. The SEO lead has to budget for cleaning up and regaining lost links.
Category 4: ROI statistics and 2025 trends (digital strategy)
These final statistics translate SEO effort into concrete business outcomes and help you position your budget strategically against the other acquisition channels.
Statistic 18: share of SEO traffic in total revenue
For companies that invest heavily in content and authority, organic traffic often accounts for 50% to 70% of total digital revenue (excluding brand). It is the most reliable channel in the long run.
Statistic 19: average conversion rate (TCO)
The conversion rate of organic traffic is generally 2 to 3 times higher than that of social traffic and often better than paid traffic (SEM), because the user arrives with a strong and qualified intent.
Statistic 20: SEO vs. SEM budget allocation (trends)
In 2025, the trend is towards rebalancing: SEO investment is growing by 15% to 20% on average, while SEA (advertising) budgets are being optimised for better returns in the face of rising cost per click (CPC).
Digging deeper: the figures by field
These 20 statistics give the overview. To act on your specific market, dive into our specialist analyses:
- GEO/SEO statistics in Switzerland: the Swiss market, its languages and its cantons.
- The 10 local SEO figures in Switzerland: Google Maps, customer reviews and local conversion.
- The 15 AI figures for B2B marketing: where AI genuinely changes things in B2B.
Securing your SEO strategy in 2025
These twenty statistics illustrate an unavoidable truth for 2025: succeeding in SEO demands rigorous analytical discipline.
The era of intuitive optimisation is over. Performance comes from constantly measuring signals (E-E-A-T, speed, Dwell Time) and making decisions based on real user behaviour.
SEO is the channel that tends to offer the best conversion rate and the most durable revenue.
➡️ Recommendation: use these statistics to prioritise your actions, justify your budgets and make sure your digital strategy sits squarely with what search engines require and, above all, with your clients' intent.
💡READ: 7 practical SEO levers for SMEs in French-speaking Switzerland
Need support?
At Smart Impact, we support companies through their digital transformation with a human-centred approach. From CRM adoption strategy to full implementation, we put our expertise at the service of your success.
Explore our digital transformation services →
📊 SOURCES
The SEO statistics presented in the article are consolidated estimates and averages drawn from the analysis of several studies published by recognised industry leaders in their forecasts for 2025.
Here are the main sources of authority and the types of data used to establish these figures:
Click-through rate (CTR) and user behaviour studies:
Sources: Ahrefs, Backlinko (Brian Dean), and SparkToro (Rand Fishkin).
Contribution: these players publish large-scale studies across millions of queries to assess CTR by position and how zero-click search is changing. The figures are averages extrapolated for 2025, taking account of the growth of SGE (Search Generative Experience) and of mobile.
Reports on Content and E-E-A-T:
Sources: Search Engine Journal, Search Engine Land, and Yoast SEO.
Contribution: these publications and tools analyse the correlation between content length, dwell time and ranking. The estimates around 2,000 words and time on page are averages of the best practice observed for earning Google's trust (E-E-A-T).
Technical analysis and link building:
Sources: SEMrush, Moz (through their ranking factor reports), and data from Google Web Vitals (through case studies).
Contribution: these platforms provide large-scale data on the average number of backlinks needed at each level of competitiveness, along with the measured effect of load speed on conversion rate and ranking.
ROI trends and budget allocation:
Sources: consultancy reports (such as McKinsey or Forrester) and studies from the IAB (Interactive Advertising Bureau).
Contribution: these sources provide the strategic view of budget allocation and compare conversion rates across channels to justify the increased investment in SEO relative to SEA.